A pivot table component for web reporting

Embed into your application. Customize to your needs. Analyze business data.

Our Clients

Join hundreds of happy customers

  • slide
  • slide
  • slide
  • slide
  • slide
  • slide
  • slide
  • slide
  • slide
  • slide
  • slide

Integrate a pivot table into any framework

Flexmonster Pivot Table provides official wrappers for React, Angular, Vue, Blazor, Svelte, and other modern frameworks, alongside native JavaScript and TypeScript APIs.

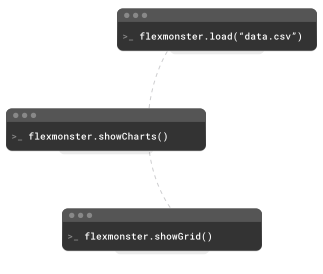
Get up and running in a few lines of code:
All integrations

Handle large datasets in the browser

Built for enterprise reporting, the component keeps the app responsive under heavy loads.
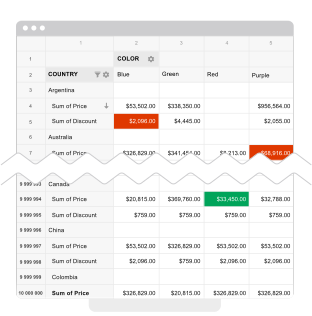
  • Aggregates 1,000,000+ records of JSON/CSV directly in the browser.
  • High-speed slicing, filtering, and drill-down of multilevel hierarchies.
One million rows demo

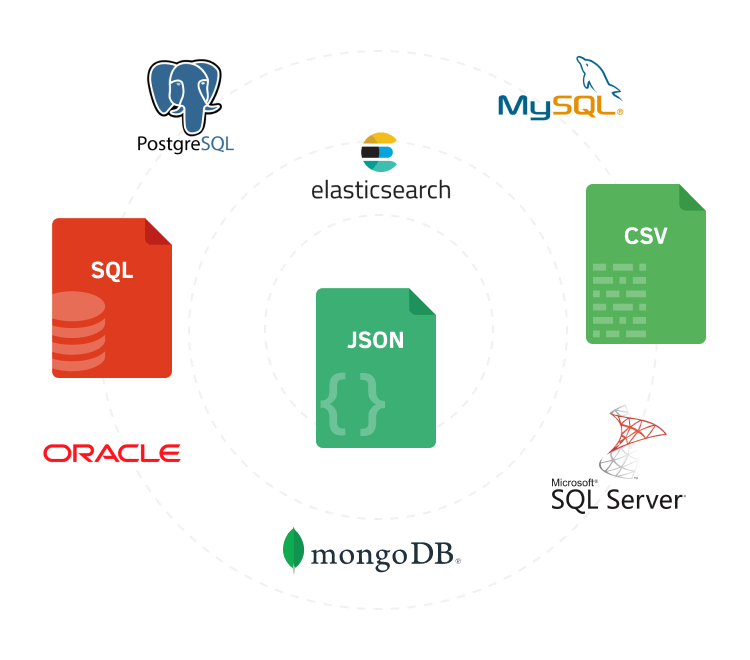
Connect to any SQL, NoSQL, or OLAP data

  • SQL: MySQL, PostgreSQL, MS SQL Server, Oracle.
  • NoSQL: MongoDB, Elasticsearch.
  • OLAP: Microsoft Analysis Services tabular and multidimensional cubes.
  • Files & APIs: CSV, JSON, any REST endpoint.
All supported data sources

Fully customizable UI and extensive API

The component is designed to easily become a part of your BI solution, CRM, ERP, SaaS, or business project, with full control over the user experience:

  • Custom themes, CSS, and full localization into any language.
  • API that covers everything from custom cell rendering to toolbar modifications.
API reference
Built for developers

A complete pivot table you don't have to build

Flexmonster is built for developers. You embed and configure it in your app; your users get a full Excel-like reporting experience out of the box.

user icon

What your users get

Interactive reporting built into the UI.


  • Drag-and-drop reporting

    Build and reshape reports by dragging fields, with no code required.

  • Filtering and sorting

    Filter by selected members, conditions, or values, then sort the results to focus on relevant data.

  • Drill-down and drill-through

    Navigate hierarchical data with drill-down and explore the records behind aggregated values with drill-through.

  • Built-in pivot charts

    Analyze data in charts with the same core pivoting capabilities as the grid: aggregation, filtering, drill-down, and drill-through.

  • Calculated values

    Create formula-based metrics that aren't present in the original dataset.

  • Conditional formatting

    Automatically highlight values that meet specific conditions and need attention.

  • Exporting

    Export reports to Excel, PDF, or CSV for further analysis.

code icon

What you get as a developer

A reporting layer that fits your stack and product.


  • Analyze millions of records

    Keep data exploration fast and responsive, even with huge datasets.

  • Integrate with any JavaScript framework

    Embed Flexmonster in React, Angular, Vue, or other applications that support JavaScript.

  • Connect to any data source

    Load data from JSON or CSV files, SQL and NoSQL databases, OLAP cubes, or custom backends.

  • Configure and extend the UI

    Choose which built-in features users can access and add custom controls for your product's workflows.

  • Bring your own charts

    Visualize Flexmonster data with your preferred third-party charting library.

  • Customize the look and feel

    Style colors, fonts, and other UI details with CSS to match your product.

  • Localize the interface

    Translate UI labels into any language with ready-made or custom localization files.

Explore API REFERENCE

A word from our clients

Flexmonster is fantastic at what it does. It allows us to offer sophisticated data manipulation to our clients. Also, their support is knowledgeable, efficient and very pleasant.

I would recommend Flexmonster for anyone looking for a simple, efficient and powerful no-frills BI solution.

We use the pivot table module from Flexmonster as a great integrated reporting tool which allows us to easily generate dynamic pivot (cube) reports in our web based solution for our customers.

Flexmonster is easy to use and very powerful in its functionality. Quick response from support and developers.

Easy tool, creates efficiency and gives possibility to create intelligent reports for end-users.

We use Flexmonster to give our end-users the possibility to analyze the operations with the Pivot Table feature, in a similar way to what they already use to do with Excel, and they highly appreciate this!

We are very satisfied with the Flexmonster reporting tool, it is so easy to use, and very fast. You may integrate it with your system easily.

One of the best products we have utilized to help analyze and visualize large data sets. The online documentation with examples is excellent and frequently updated. The product itself has very frequent enhancements and updates.

Before Flexmonster, creating customized reports required technical knowledge and significant involvement from the IT team. Now, end users can easily build, filter, and adjust their own reports without depending on technical support

I'm very satisfied with this tool. It makes data analysis much easier while allowing users to explore and use the results in their own way, with fast performance and a high level of detail.

It offers a very lightweight and flexible way to visualize tables and graphs, without the need for a BI solution, which would be more expensive to implement in a similar way. We're very happy to have them incorporated into our main B2B solution. Great support too.

View more on Capterra

Frequently asked questions

Can't find your answer?
Visit the FAQ

Flexmonster Pivot Table & Charts is a JavaScript pivot table component for adding interactive reporting and data analysis to web applications. Users can summarize, filter, sort, and explore data in pivot tables and charts, drill into results, and export reports.