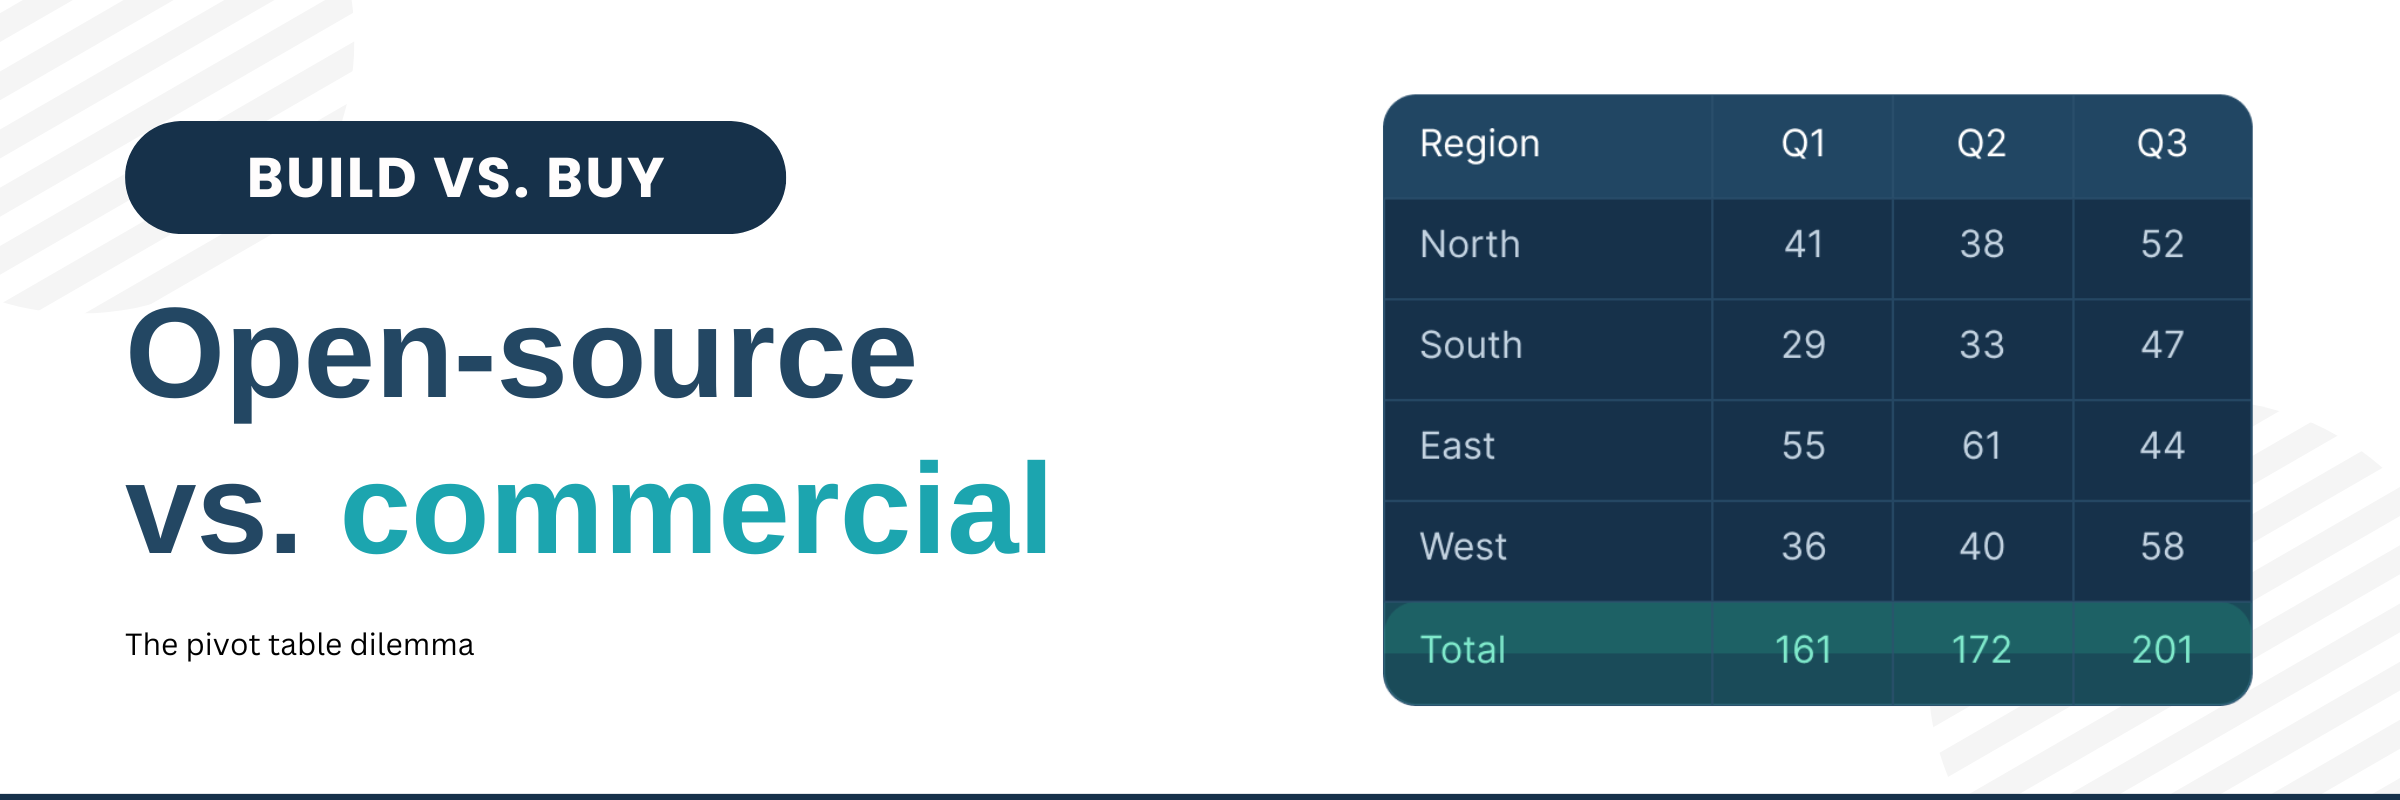
Deciding between open-source and commercial software is one of the toughest calls you make when starting a new web project. There are many different myths and opinions, and each time, the same arguments come back: cost, flexibility, speed, and control.
Modern web applications are expected to do more than display data, users want interactive dashboards, real-time reports, and powerful analysis tools built right in. When looking for solutions, developers often consider a range of options, from BI platforms and pivot table libraries to spreadsheets and data grids, depending on the project’s needs and use cases.
In this article, you’ll find out where Flexmonster fits the best based on real use cases and capabilities. For your convenience, we’ll highlight the main difference at the end of each section.
We know you’ve been keeping a close eye on our roadmap, and we’ve got some news for you. As we continue rolling out component development with Flexmonster 3.0, we’re thrilled to announce the latest update.
Step by step, we’re getting closer! Flexmonster Pivot 3.0 (preview 2) is out.
We are currently in the middle of developing Flexmonster 3.0, and our team has been carefully rethinking key parts of the product to make everyday workflows smoother, faster, and more intuitive. One of the areas that received the most attention this time is filtering, as the core feature for navigating complex datasets.
The audit field is changing fast, auditors today work with far more information than they used to. This data overload slows traditional manual analysis, and the need for new tools grows.
The pivot table feature in Excel has long been helpful for summarizing and exploring data. However, as datasets become larger, such standard tools often fall short, highlighting the need for more flexible solutions. At the same time, Excel remains the primary tool for many auditors.
Nowadays, data is an important part of almost every decision-making process: from industrial production planning to financial market analysis. Companies are no longer just collecting data; they are expected to analyze it in real time, detect trends early, and react quickly to changes. As datasets grow larger and more complex, people need a powerful solution, and here comes Flexmonster.
One of the most powerful features of our pivot table is a wide variety of aggregations. You have two options for applying aggregations: via UI or code. Let’s look at the advantages and disadvantages of both of these methods:
UI: here, you can do it easily, even if you have no prior coding experience. All you need to do is go to Fields on the Toolbar and set it up. Also, it’s quite intuitively understandable for users.
Being professionals and data enthusiasts, the Flexmonster team is dedicated to creating lightning-fast analytical solutions. We stand behind successful products, including the free WebDataRocks Pivot Table, our feature-rich Flexmonster Pivot component, and the DataTableDev library. Although Flexmonster Desktop was once integral to our strategy, we have revised our perspective and chosen to discontinue the application, dedicating more resources to our core mission.
Starting with version 3.0, Flexmonster introduced a powerful, two-part structure: the Flexmonster server, which manages heavy-duty backend data processing, and the Flexmontser Pivot UI, which handles final client-side visualization. This architecture significantly boosts performance and scalability.
To make backend management more comfortable and intuitive, we have thoroughly redesigned the Admin Panel, prioritizing clarity, control, and ease of use.
So, we are excited to present the updated Admin Panel that will be available in 3.0 version! Below, we will provide a brief overview of its main functionality and explain how each part can be helpful to you.
The variety of data sources for Flexmonster makes it easier to find the perfect option for your project. At the same time, choosing the right data source is very important and can influence your experience with Flexmonster. So this article is here to help you make the right choice.
Get ready for a fresh new look. We've made some delightful changes to the Client's Area to upgrade your experience. While all the tabs you're familiar with are still there, we've given the design a stylish and pleasant refresh. The new, more intuitive layout makes navigating a breeze.
So, let’s check what you should expect when you log in.
We're continuing our series of articles on core pivot table features. Last time, we covered filtering. You can revisit that topic here: Mastering Filtering in Flexmonster Pivot. Now, we can move on to sorting.
Have you already tried using Flexmonster from the previous article? If so, you should already know that it's a powerful yet simple web tool that is handy in visualizing big datasets. Flexmonster helps you turn your data into clear, interactive reports. And of course, it offers sorting functionality to help you prioritize information with one click.