 asked on March 24, 2026
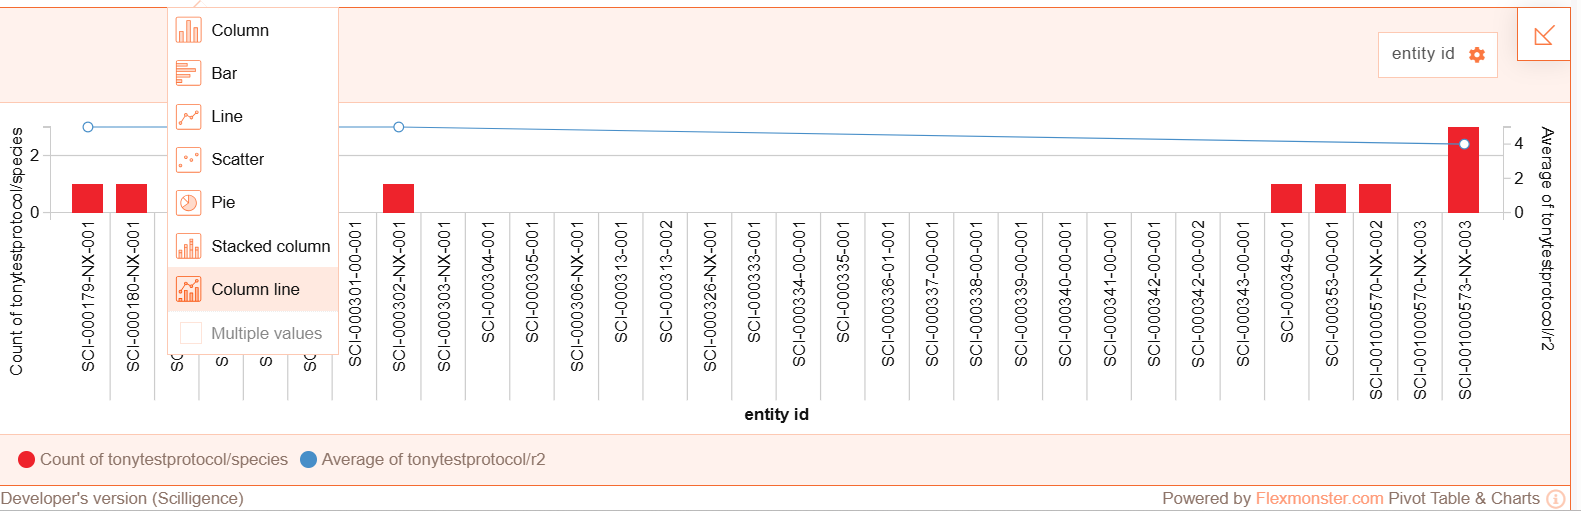
There is a dropdown in every chart type where we can select the parameters to show but in this specific chart type - 'Columns Line' we can't. Do you know why and how to customize it? See the attached screenshot.
 ⋅ March 25, 2026
Hello, Nikita!
Thank you for reaching out to us.
Kindly note that most of the Flexmosnter Pivot Charts work with one measure, or with any number of measures if "Multiple values" is selected. However, the column line chart is special - it works with exactly two measures at a time. We recommend using the Field List to select measures for a column line chart. The component will take the first two measures from a Values box to create a chart.
Hope it helps. Feel free to ask if there are any further questions.
Kind regards,
Solomiia

