This guide shows how to switch between Flexmonster layouts and describes their differences.
By default, Flexmonster displays data in the compact form. You can also use the classic pivot table and the flat table to analyze data from different angles.
In addition, Flexmonster provides built-in interactive charts. Learn more in the Flexmonster Pivot Charts guide.
Step 1. Select Options on the Toolbar. As a result, the Layout options pop-up window will appear.
Step 2. In the pop-up window, choose the layout from the Layout section:
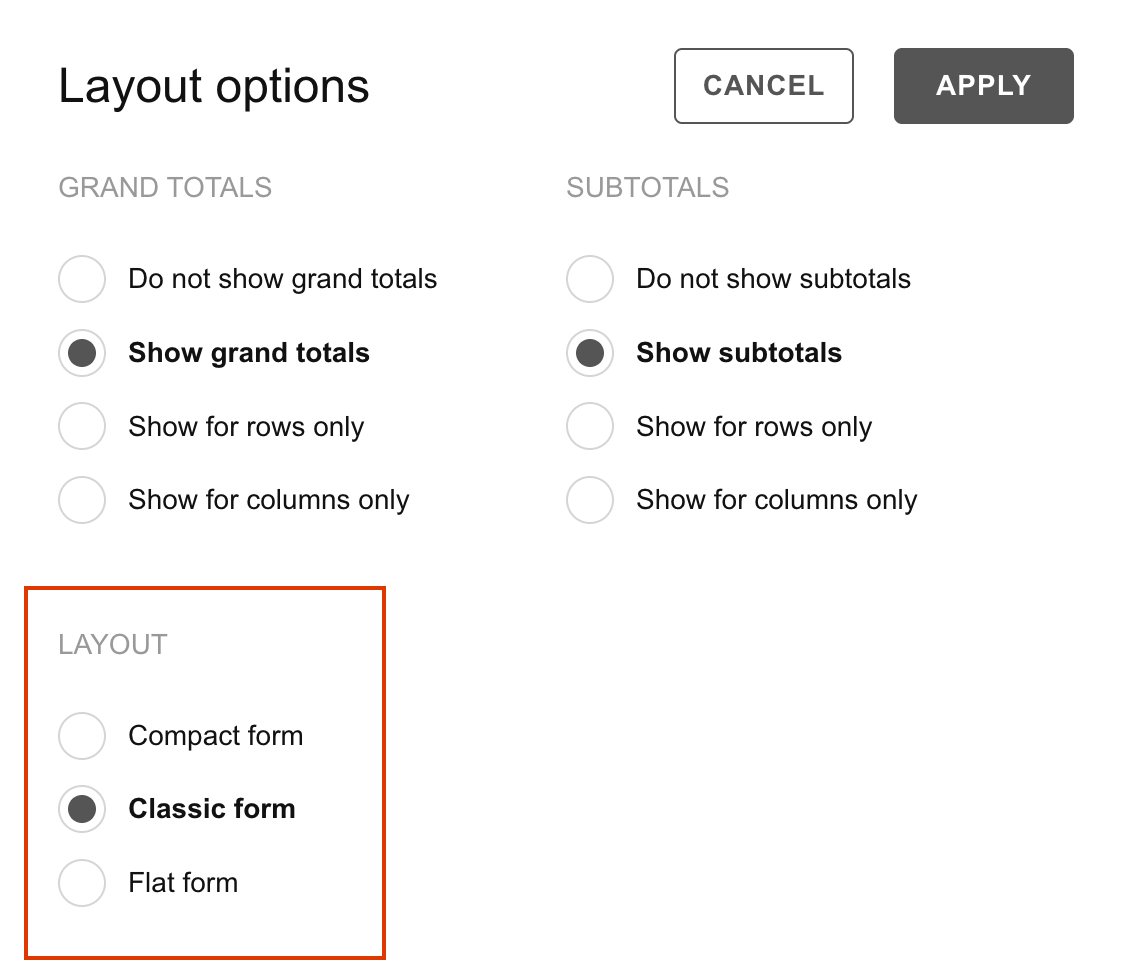
Step 3. Select the Apply button to see the changes.
In the Layout options pop-up window, you can also manage how grand totals and subtotals are shown.
To predefine a grid layout in the report, specify the options.grid.type property:
report: {
  dataSource: {
    filename: "data/data.csv"
  },
  options: {
    grid: {
      type: "classic"
    }
  }
};Learn about other available grid options.
To change the grid layout at runtime, use the setOptions() method. Your code should look similar to the following:
pivot.setOptions({
  viewType: "grid",
  grid: {
    type: "classic"
  }
});

pivot.refresh();In Flexmonster, data is displayed in the compact form by default. Learn how this layout works:
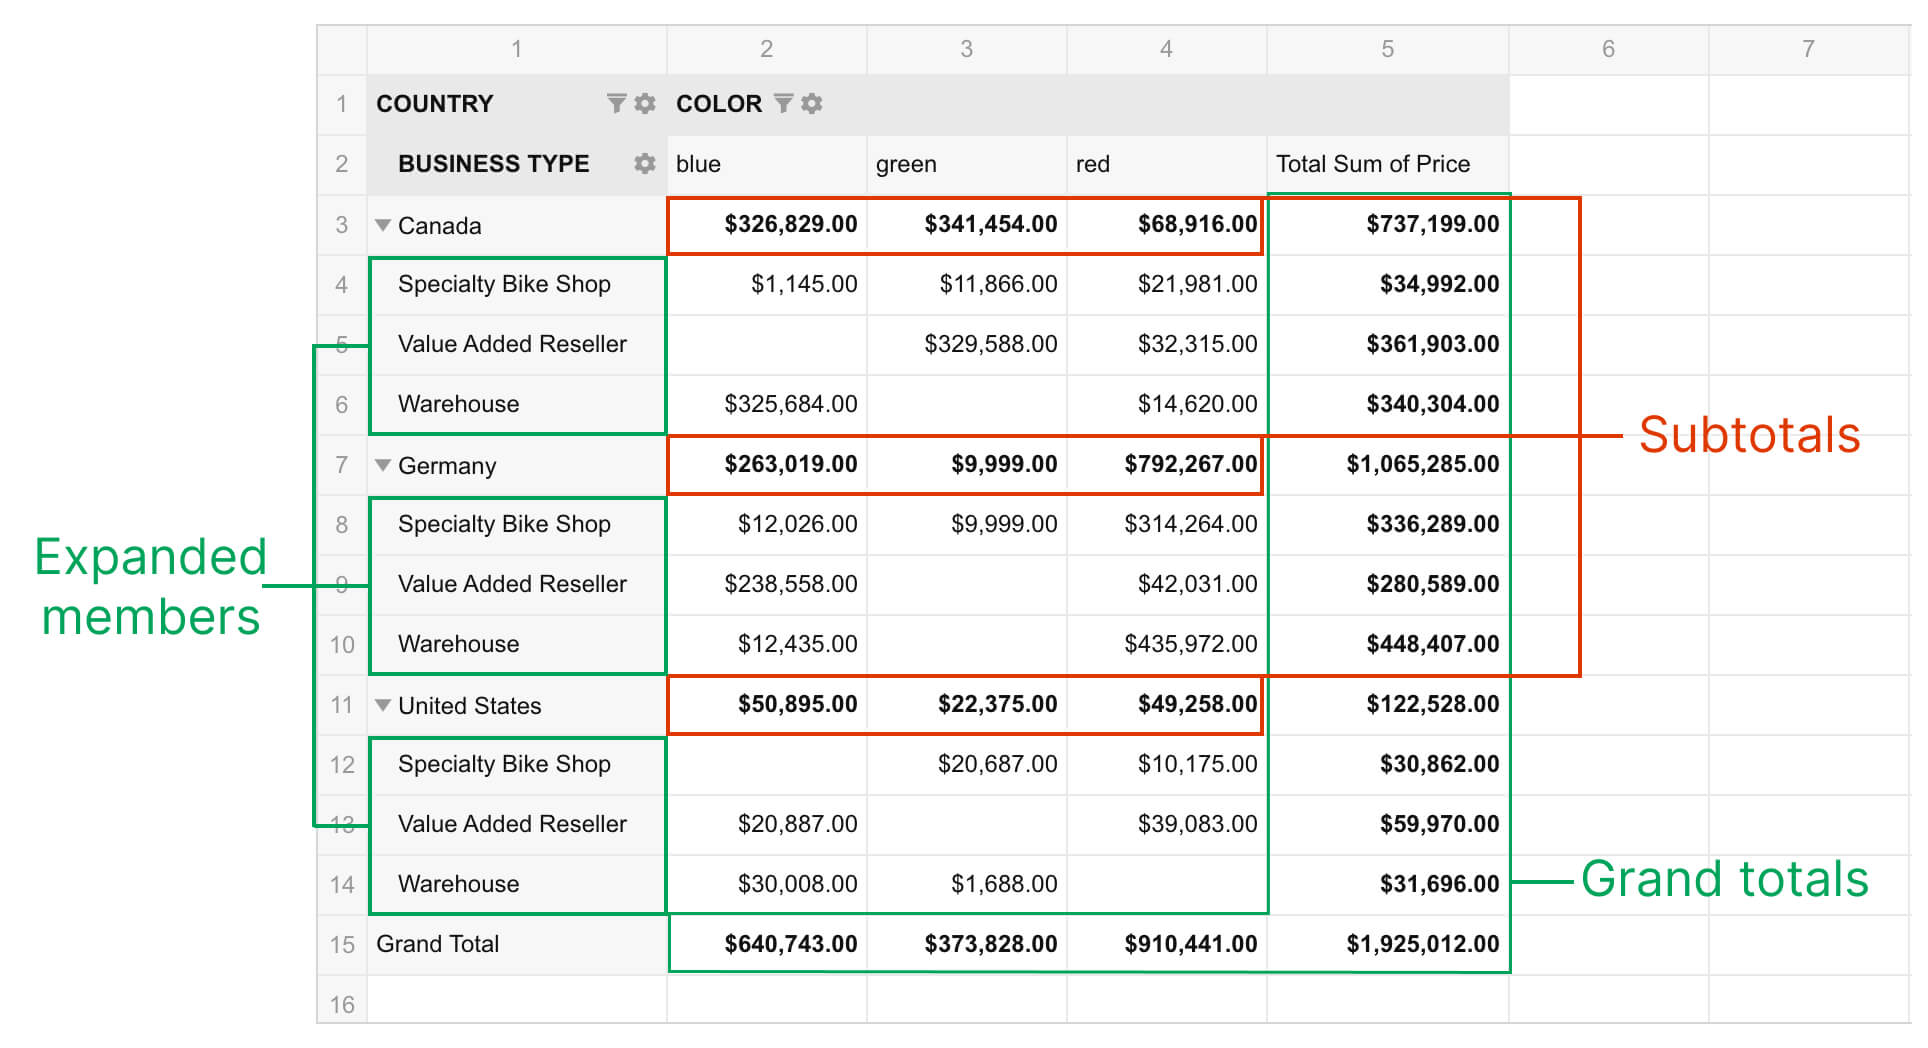
Check out our compact form live demo.
The classic pivot table layout is for users who prefer an Excel-like layout of fields. See the key features of the classic layout:
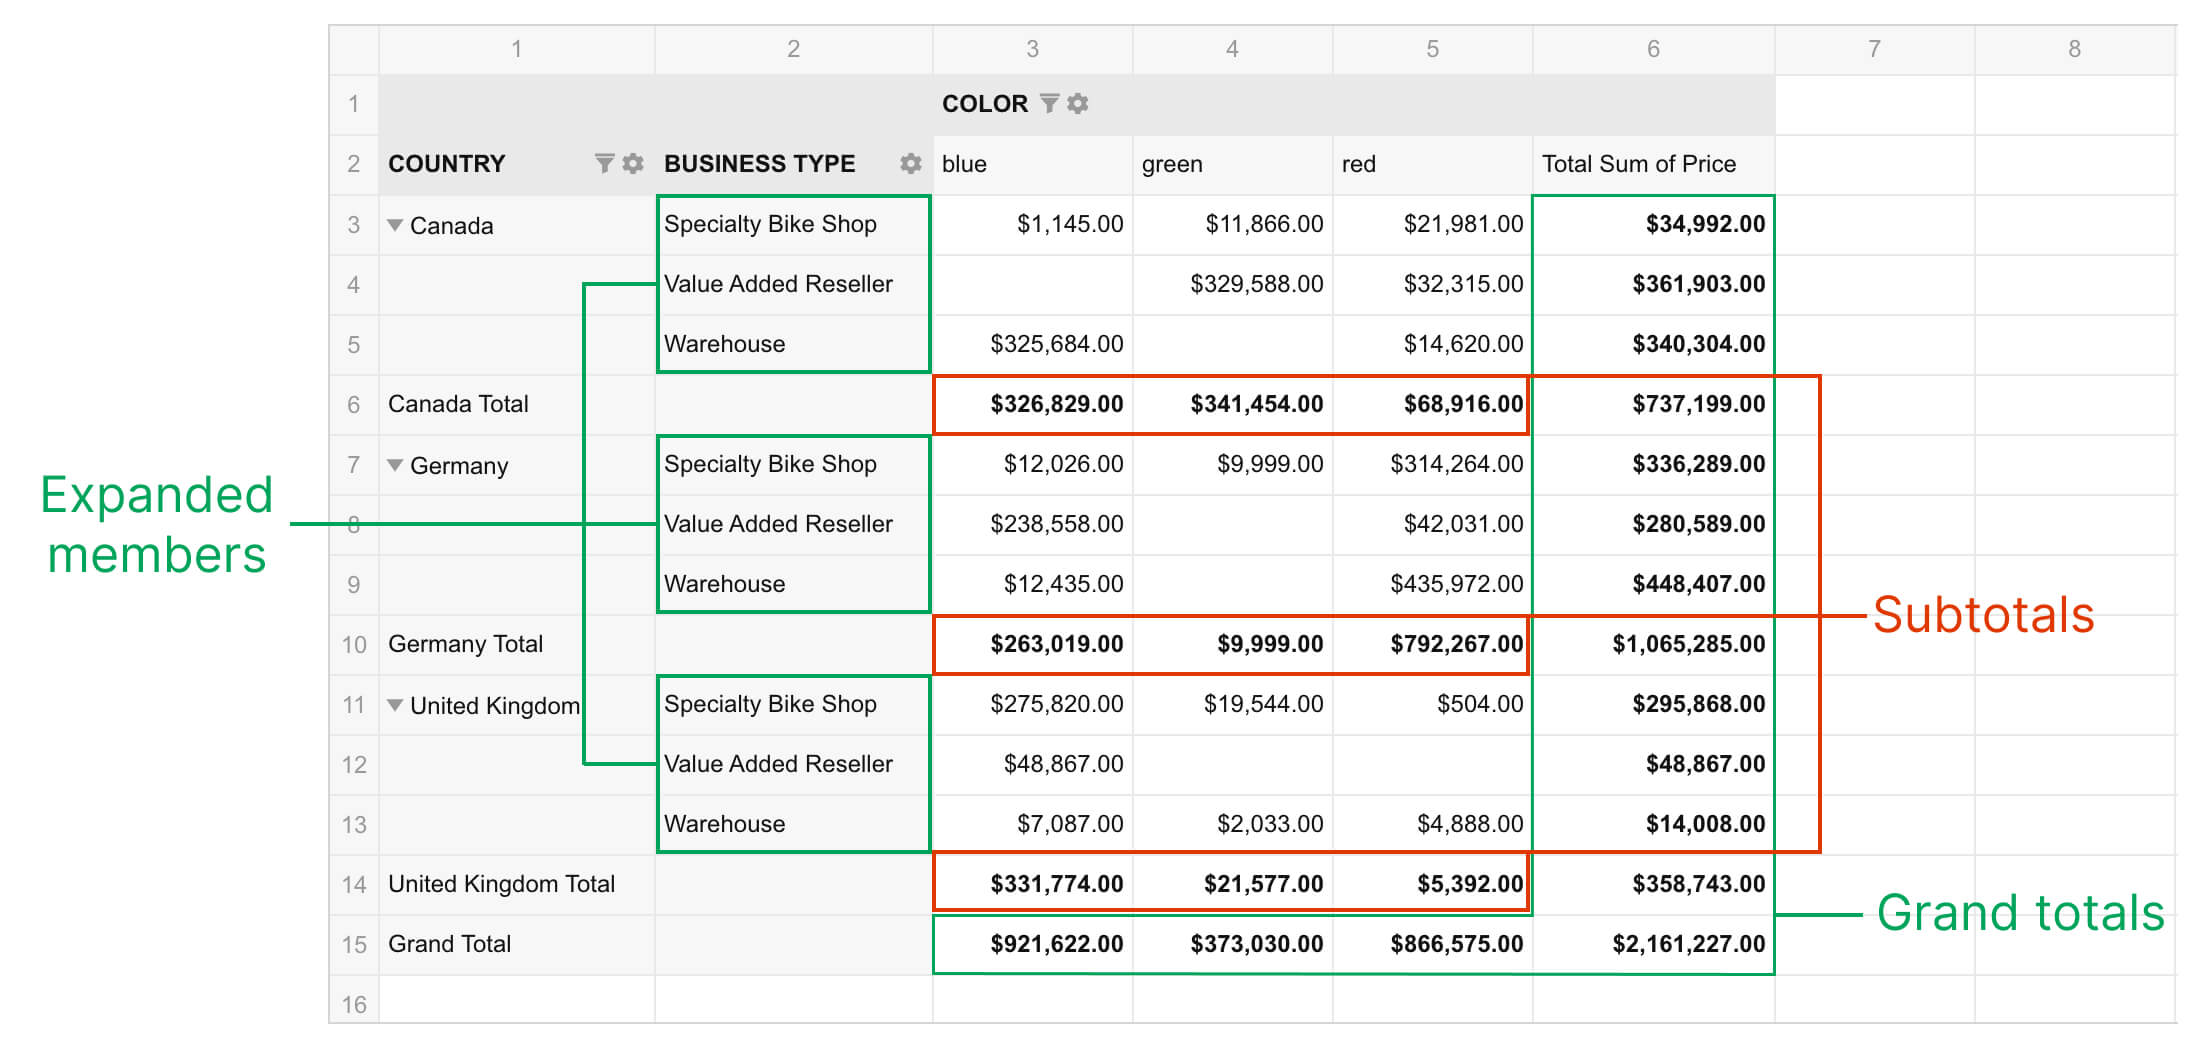
See the classic view demo.
Note The header area in the classic form is frozen and can not be scrolled. If your report contains many expanded fields or deep multilevel hierarchies in rows, the frozen area may occupy too much space, and the values may not be visible:
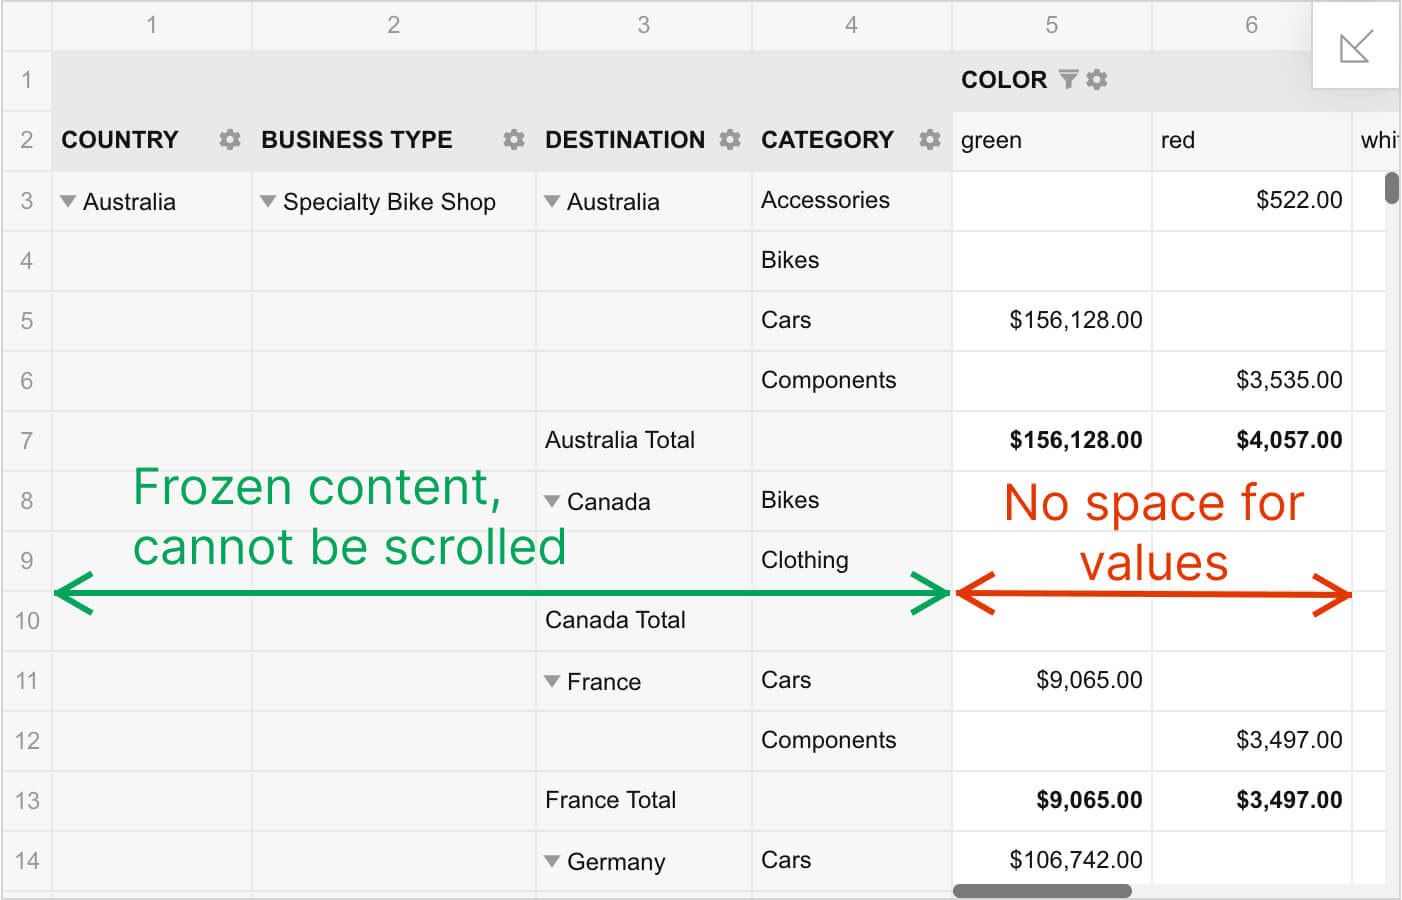
Such a configuration may complicate the work with Flexmonster, so we recommend switching to the compact form.
The flat table represents the dataset in its original structure. It is the most basic layout. Check out the key characteristics of the flat view:
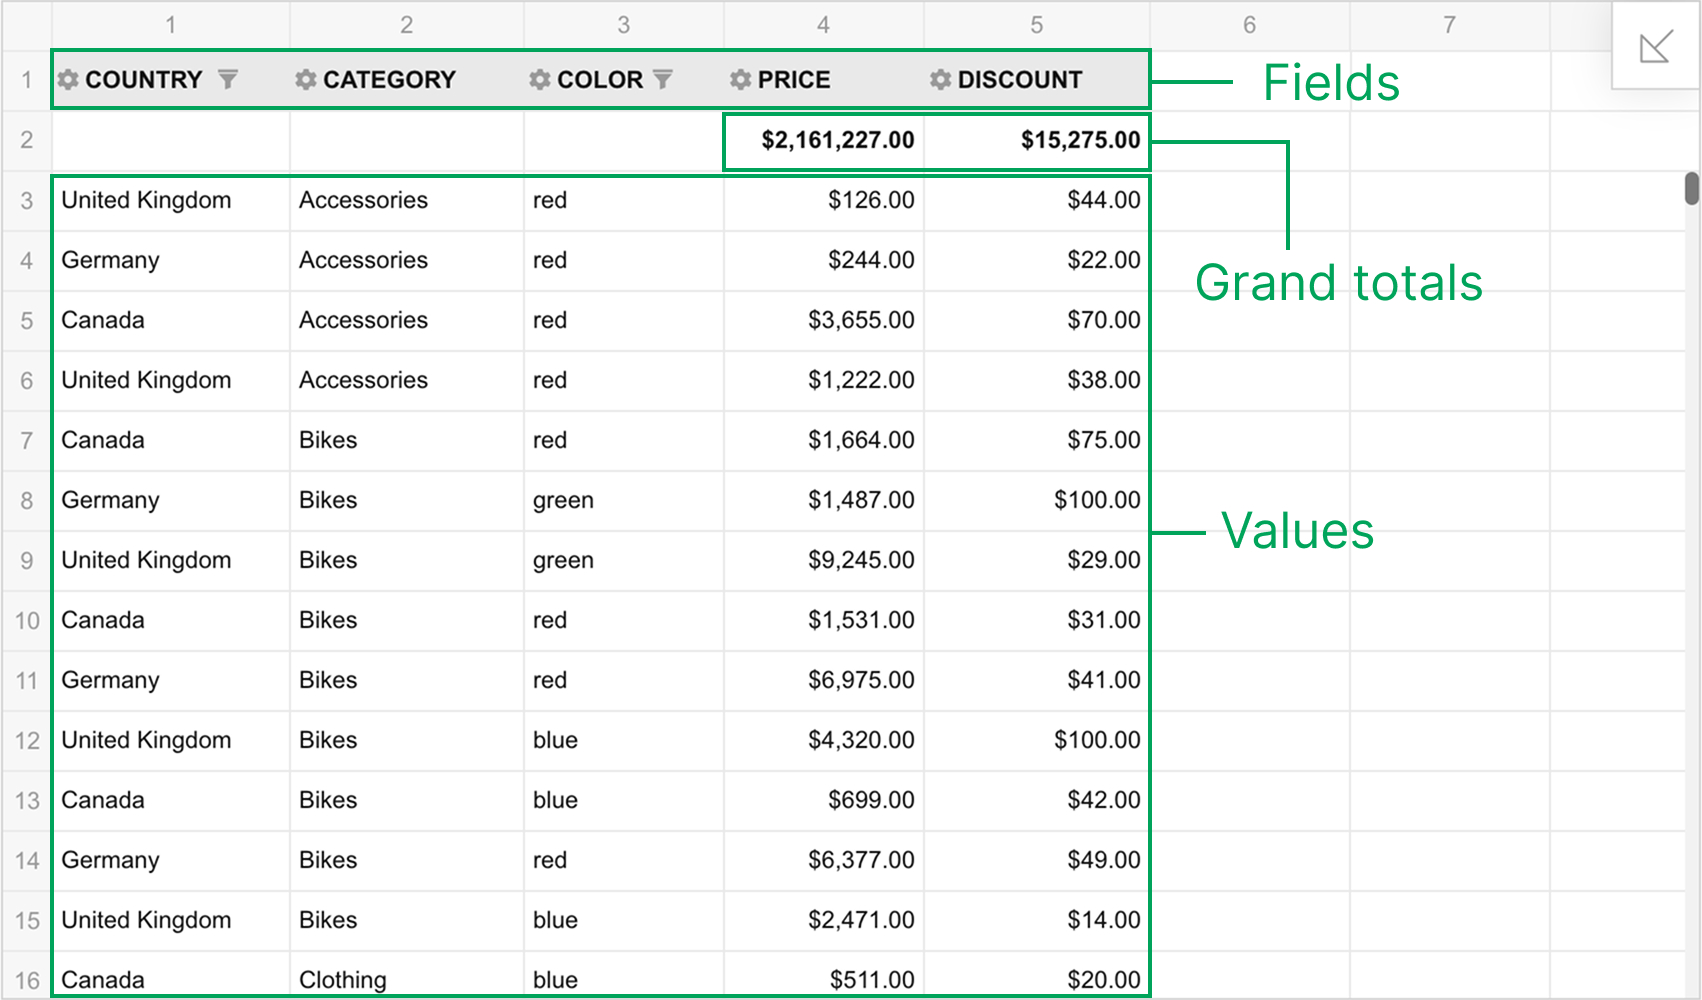
Check out our live demo with a flat table.
Note Since the flat table displays non-aggregated data, performance may decrease when connecting to large datasets. In such cases, consider switching to the compact or classic (tabular) pivot layout.
Can't find your answer?
Visit the FAQ
Flexmonster Pivot Table & Charts is a JavaScript pivot table component for adding interactive reporting and data analysis to web applications. Users can summarize, filter, sort, and explore data in pivot tables and charts, drill into results, and export reports.

