This guide explains:
When multiple fields are placed in rows or columns, all nodes are collapsed by default. As a result, only summarized data is shown until you expand the nodes. Learn how to expand the data and see more details.
If you want to preset expanded members in your report, we recommend the following approach:
Your report will now contain the info about expanded fields in the slice.expands property. If needed, you can edit this configuration programmatically.
Expand a specific node using the expandCell() API call:
pivot.expandCell("rows", ["Accessories", "Canada"]);To collapse a specific node, use the collapseCell() API call.
You can also expand all nodes of the specified field using the expandData() API call:
pivot.expandData("Country");To collapse all nodes of the specified files, use the collapseData() API call.
Note expandData() and collapseData() work only for the CSV and JSON data sources.
Expand or collapse a member’s inner field values by selecting the arrow icon to the left of the member's name:
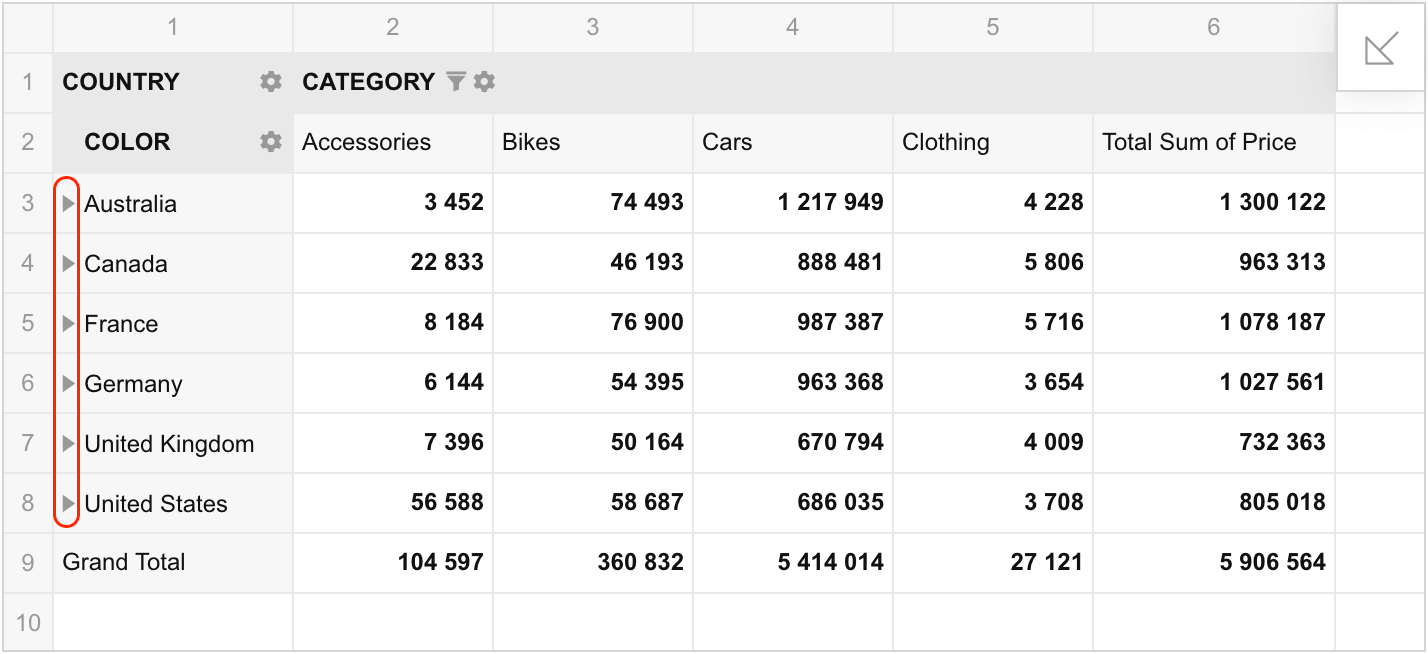
You can expand data only in rows or columns using the slice.expands.expandAllRows or slice.expands.expandAllColumns property, respectively:
slice: {
  expands: {
    expandAllRows: true
  },
  // Other slice configs
}
To expand data only in rows or columns, call the expandAllData() method with the specified type parameter:
pivot.expandAllData("rows");To expand all data nodes at once, set the slice.expands.expandAll property to true:
slice: {
  expands: {
    expandAll: true
  },
  // Other slice configs
}
To expand all data nodes at once, use the expandAllData() API call:
pivot.expandAllData();
Note If your slice has a lot of nested levels, expandAllData() can lead to excessive memory consumption and instability.
To collapse all data nodes at once, use the collapseAllData() API call.
If you have multilevel hierarchies in the slice, only the top level is visible on the screen by default. Learn how to drill the data and see more details.
If you want to preset drills in your report, we recommend the following approach:
Your report will now contain the info about the drilled fields in the slice.drills property. If needed, you can edit this configuration programmatically.
You can drill down a cell using the drillDownCell() API call:
pivot.drillDownCell("columns", [], null, "2021");To drill up the cell, use the drillUpCell() API call.
Drill up and down multilevel hierarchies by selecting a link next to the member name:
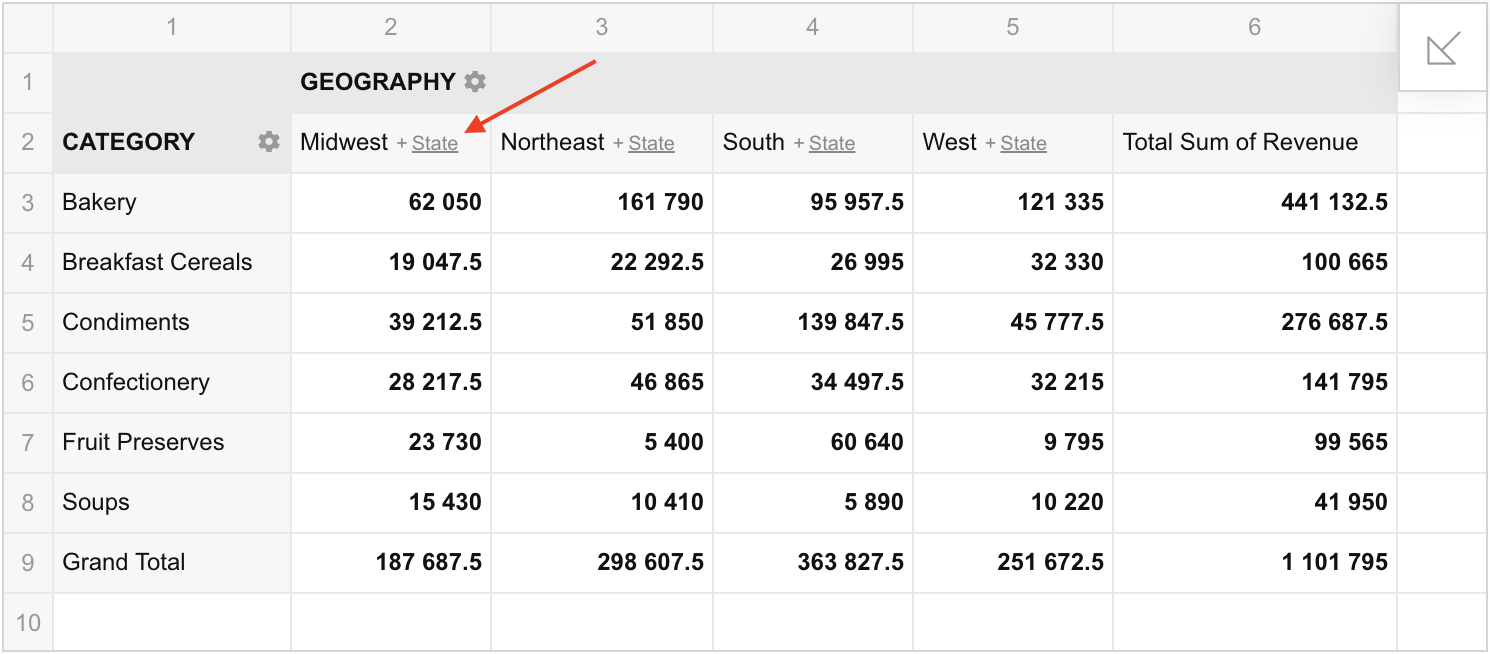
You can drill down multilevel hierarchies in rows or columns using the slice.drills.drillAllRows or slice.drills.drillAllColumns property, respectively.
Note the following:
slice.drills.drillAllRows works only when the slice.expands.expandAllRows or the slice.expands.expandAll property is set to true.slice.drills.drillAllColumns works only when the slice.expands.expandAllColumns or the slice.expands.expandAll property is set to true.slice: {
expands: {
expandAllRows: true
},
drills: {
drillAllRows: true
},
// Other slice configs
}To drill down all multilevel hierarchies at once, set the slice.drills.drillAll to true. This property works only when the slice.expands.expandAll property is set to true:
slice: {
  expands: {
    expandAll: true
  },
  drills: {
    drillAll: true
  },
  // Other slice configs
}Can't find your answer here?
Visit the FAQ page
Flexmonster Pivot Table & Charts is a JavaScript pivot table component for adding interactive reporting and data analysis to web applications. Users can summarize, filter, sort, and explore data in pivot tables and charts, drill into results, and export reports.

