


Flexmonster 3.0 + Apache ECharts: Bring charts into your dashboards
We continue to expand Flexmonster v3’s dashboarding capabilities! You can now add a wide range of interactive Apache ECharts visualizations to your Flexmonster dashboard.
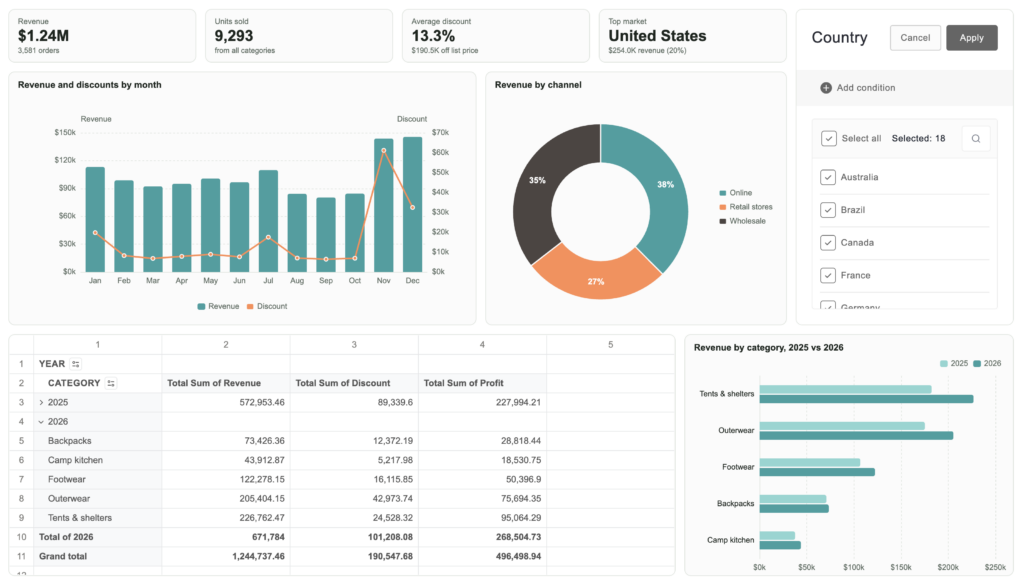
Let's look at how the integration works and which charts you can build today.
How it works: The ECharts adapter
Flexmonster and ECharts have different strengths. Flexmonster takes care of the data: loading, aggregating, filtering, and sorting it. ECharts offers a wide range of chart types and customization options. The Flexmonster ECharts adapter brings the two together, so you can use Flexmonster's data processing with ECharts visualizations.
The idea is simple: you set up an ECharts instance the way you like, and the adapter fills the chart with data from Flexmonster. Your chart becomes an interactive part of the dashboard, staying in sync with the tables. When a user filters or sorts the data, the chart updates automatically.
Learn more about the adapter and its API.
Supported charts
The following charts are supported:
- Bar
- Line
- Area
- Pie
- Funnel
- Scatter
- Effect scatter
- Map
- Gauge
For these chart types, the Flexmonster ECharts adapter provides ready-made data mapping. You specify the chart type, and the adapter creates the chart series and fills them with your data.
See our guide for more details on integration with ECharts.
More control over the charts
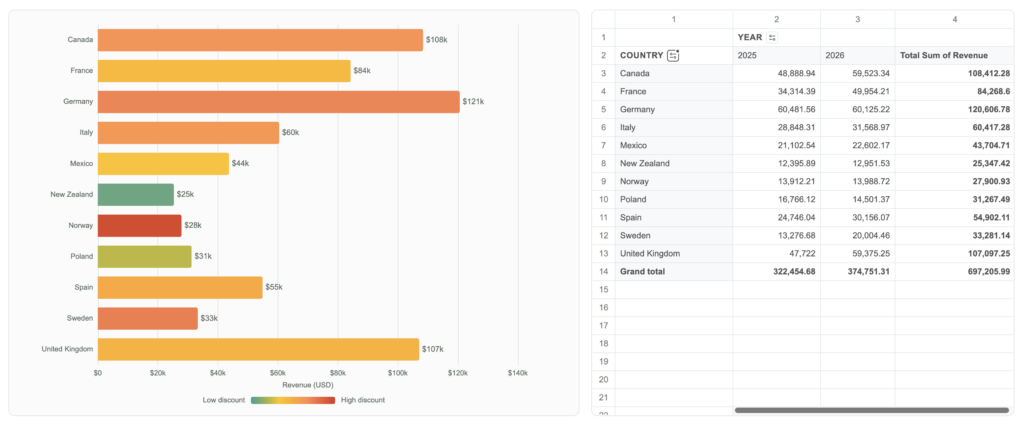
If you want to create something more custom and define how the data maps to each chart series yourself, the adapter can provide your data as an ECharts dataset.
Check out an example of a chart built this way. Here, bar lengths correspond to revenue amounts, and bar colors show the discount level:
Build dashboards with tables and charts
Now let's see the integration in action. In the video below, we build a dashboard with a pivot table and charts connected to the same data. Then we explore the data to show how filtering and sorting in the table are instantly reflected in the charts.
Save your dashboards
Once your Flexmonster and ECharts dashboard is ready, you can save it for later use with all the controls, data sources, and settings. Get the config object through the API or download a JSON file by clicking Save on the toolbar. You can then restore the dashboard and pick up right where you left off.
What's next
Next up is number formatting, another step toward making Flexmonster v3 fully production-ready.
Check back soon!