


Pivot Tables in Auditing: A Foundation for Insight
The audit field is changing fast, auditors today work with far more information than they used to. This data overload slows traditional manual analysis, and the need for new tools grows.
The pivot table feature in Excel has long been helpful for summarizing and exploring data. However, as datasets become larger, such standard tools often fall short, highlighting the need for more flexible solutions. At the same time, Excel remains the primary tool for many auditors.
As you may have experienced, Excel does have some limitations. It can freeze on very large datasets and struggle with more complex tasks, such as advanced calculations. Because of this, many audits now require modern tools to keep pace with evolving data needs.
Also, business intelligence solutions such as Power BI are widely used. However, the choice of tools depends on the task, and in many cases, such solutions can be too complex, taking a lot of time to set up and learn.
In this article, you will be introduced to Flexmonster Pivot Table & Charts, a powerful JavaScript tool for analyzing and visualizing data, and how it could enhance an auditor's workflow.
Note: Flexmonster is a JavaScript pivot table component designed for embedding in web applications, CRMs, internal platforms, and other software tools. It's not a standalone app like Excel. You'll need a developer to integrate it into your company's system. If you're not a tech person interested in exploring Flexmonster, please reach out to your development team to evaluate how it could be implemented in your environment. For now, you can play with the demos on our website.
Introducing Flexmonster: A Smarter Web Pivot Table Tool for Auditors
Flexmonster is designed to handle complex datasets from multiple sources. It's a JavaScript component that runs directly in web apps, making it ideal for quickly and smoothly working with large datasets. It processes millions of rows without slowing down, making it ideal for reviewing full audit logs or year-long transaction records. This speed helps auditors catch details that might be missed when using other tools.
Another important advantage is how easily Flexmonster connects to different data sources (SQL databases, CSV, JSON, and more). That means no more wasting time pulling data together manually.
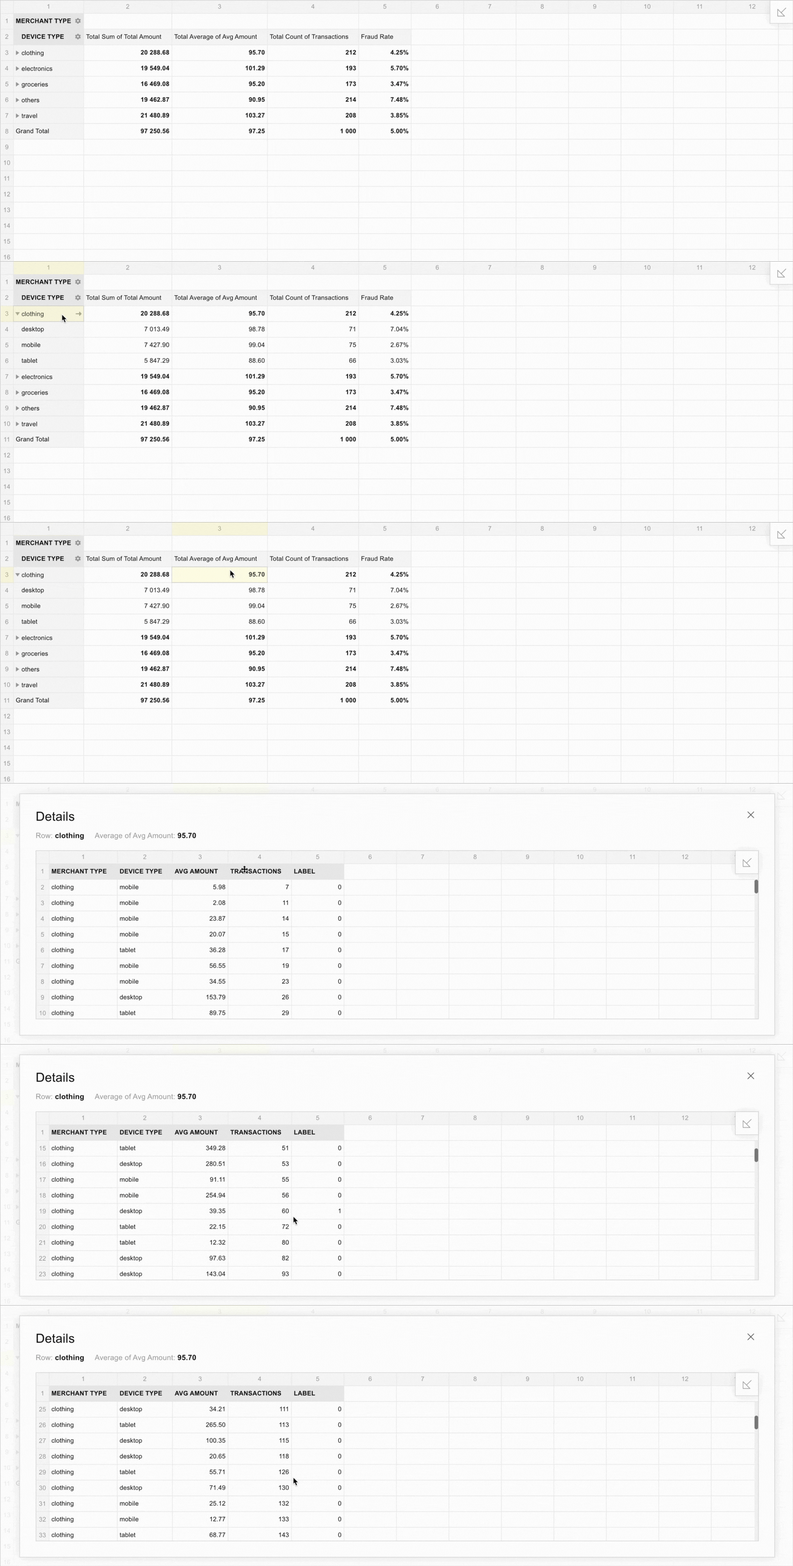
Flexmonster includes a basic set of features expected in a pivot table: aggregation, filtering, sorting, and grouping. It also offers a drill-up and down function. For example, when you see something worth investigating, you don't need to dig through another tool. Double-click any cell to drill down into the source data.
You can filter and sort the data in particular ways by any field that matters to your audit. Need to find high-value transactions or focus on specific data? It takes only a few clicks to get there. Multi-column sorting helps spot patterns you might miss, such as high-value transactions clustered around specific dates. And our Toolbar helps you easily set up and customize the report in any way you need.
Built-in charts make it easy to present your insights. Visuals like bar or line charts can quickly show changes over time or break down categories in a way that's easy to share with your team or stakeholders. And if you already use some chart libraries, we have great news for you! You can integrate them with Flexmonster Pivot Table.
Thanks to our flexible API, Flexmonster also integrates seamlessly with existing audit systems. The developers can customize how it looks and works, so it blends seamlessly into your corporate tools and has a low learning curve. Flexmonster also supports cross-device compatibility, allowing auditors to access their reports on desktops, laptops, or even tablets without installing additional software.
When you're done, share and archive your analysis. You can export reports to Excel, PDF, CSV, or even as image files, making it simple to include pivot views in audit documentation or share with stakeholders.
Flexmonster in Action: Audit Use Cases
So, how do these features actually help auditors on a daily basis? Let’s take a look at some real use cases.
In fraud detection, auditors can use a pivot table to quickly compare different categories of activity. Custom calculations, such as average transaction amount and fraud rate, help identify patterns of abnormal behavior across different merchant groups.
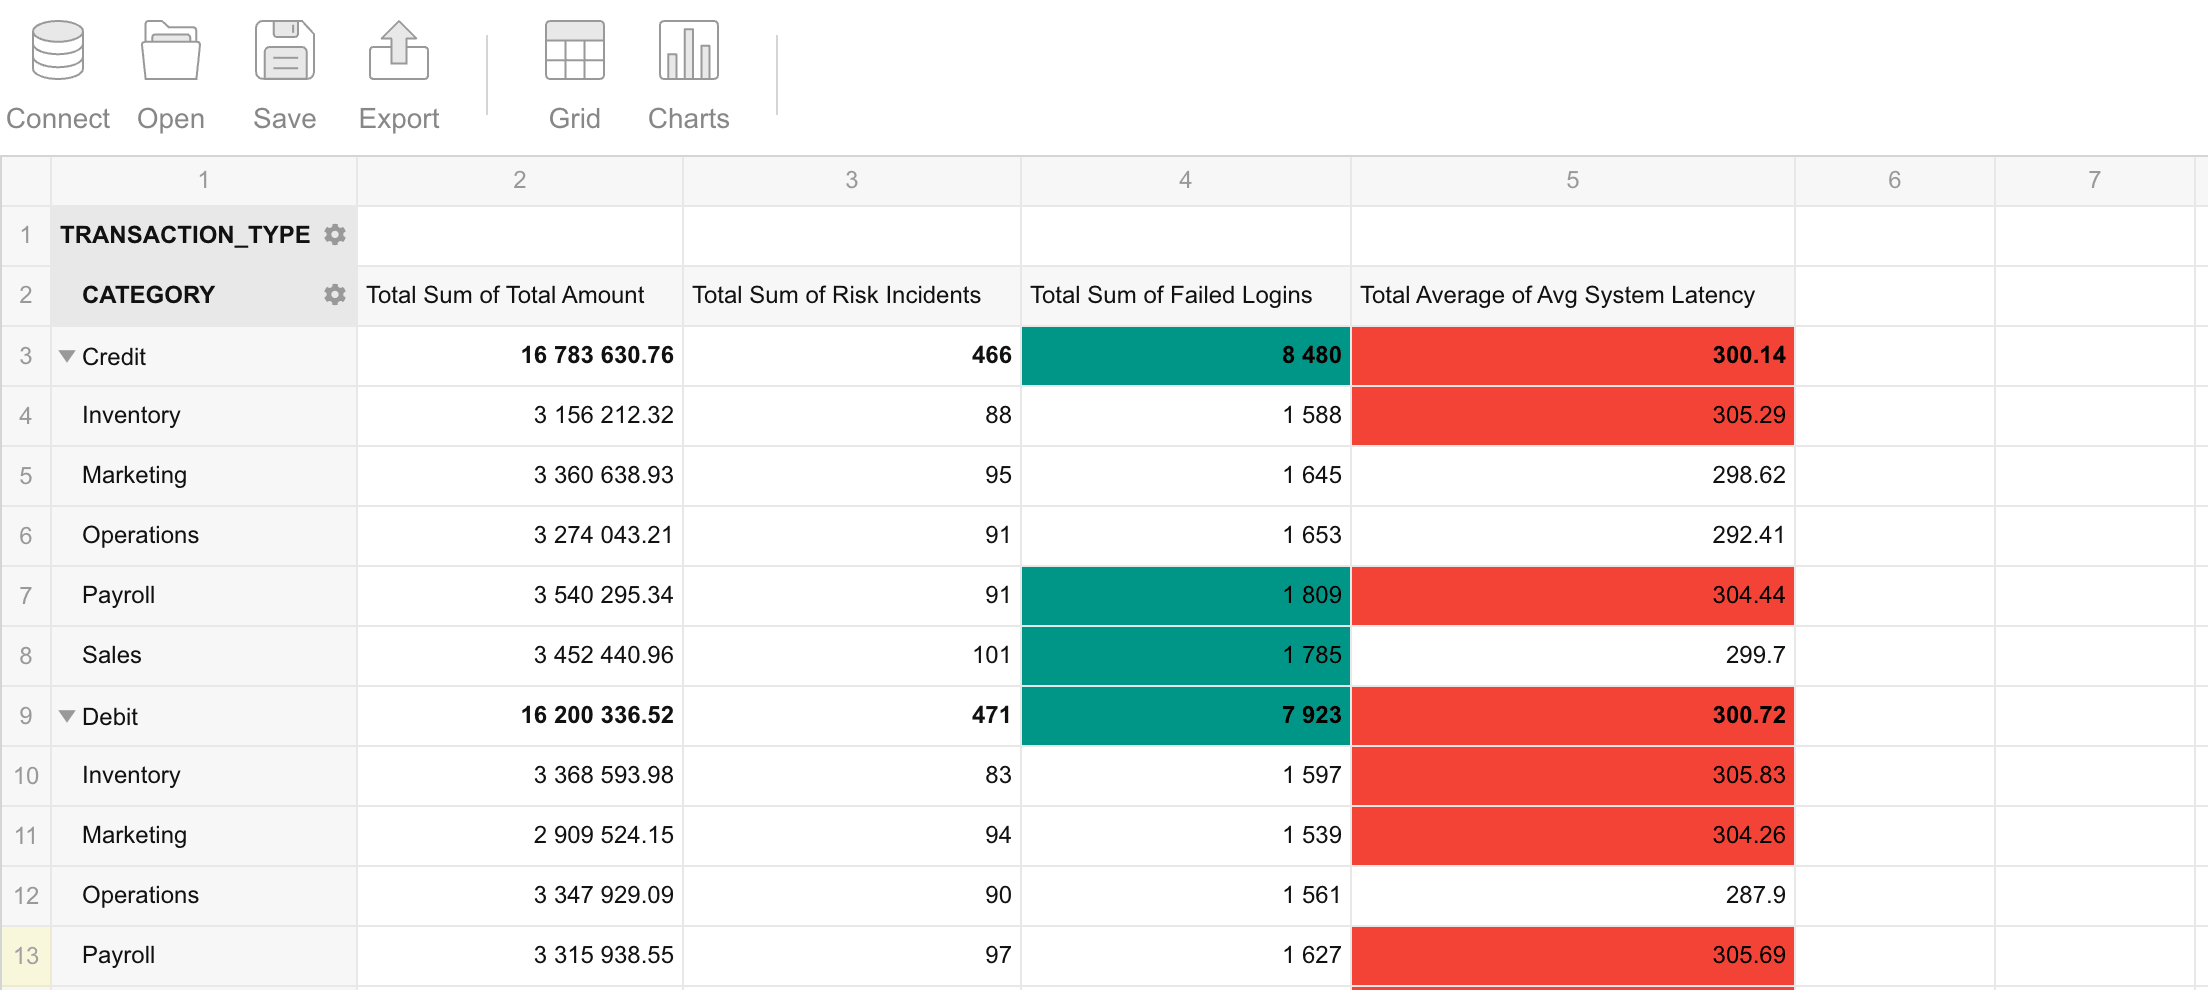
For risk assessment, Flexmonster helps auditors move from raw data to clear, actionable insights. Instead of manually scanning thousands of transactions, they can define custom risk metrics and instantly highlight problematic areas.
For example, to make high-risk areas stand out by using conditional formatting:
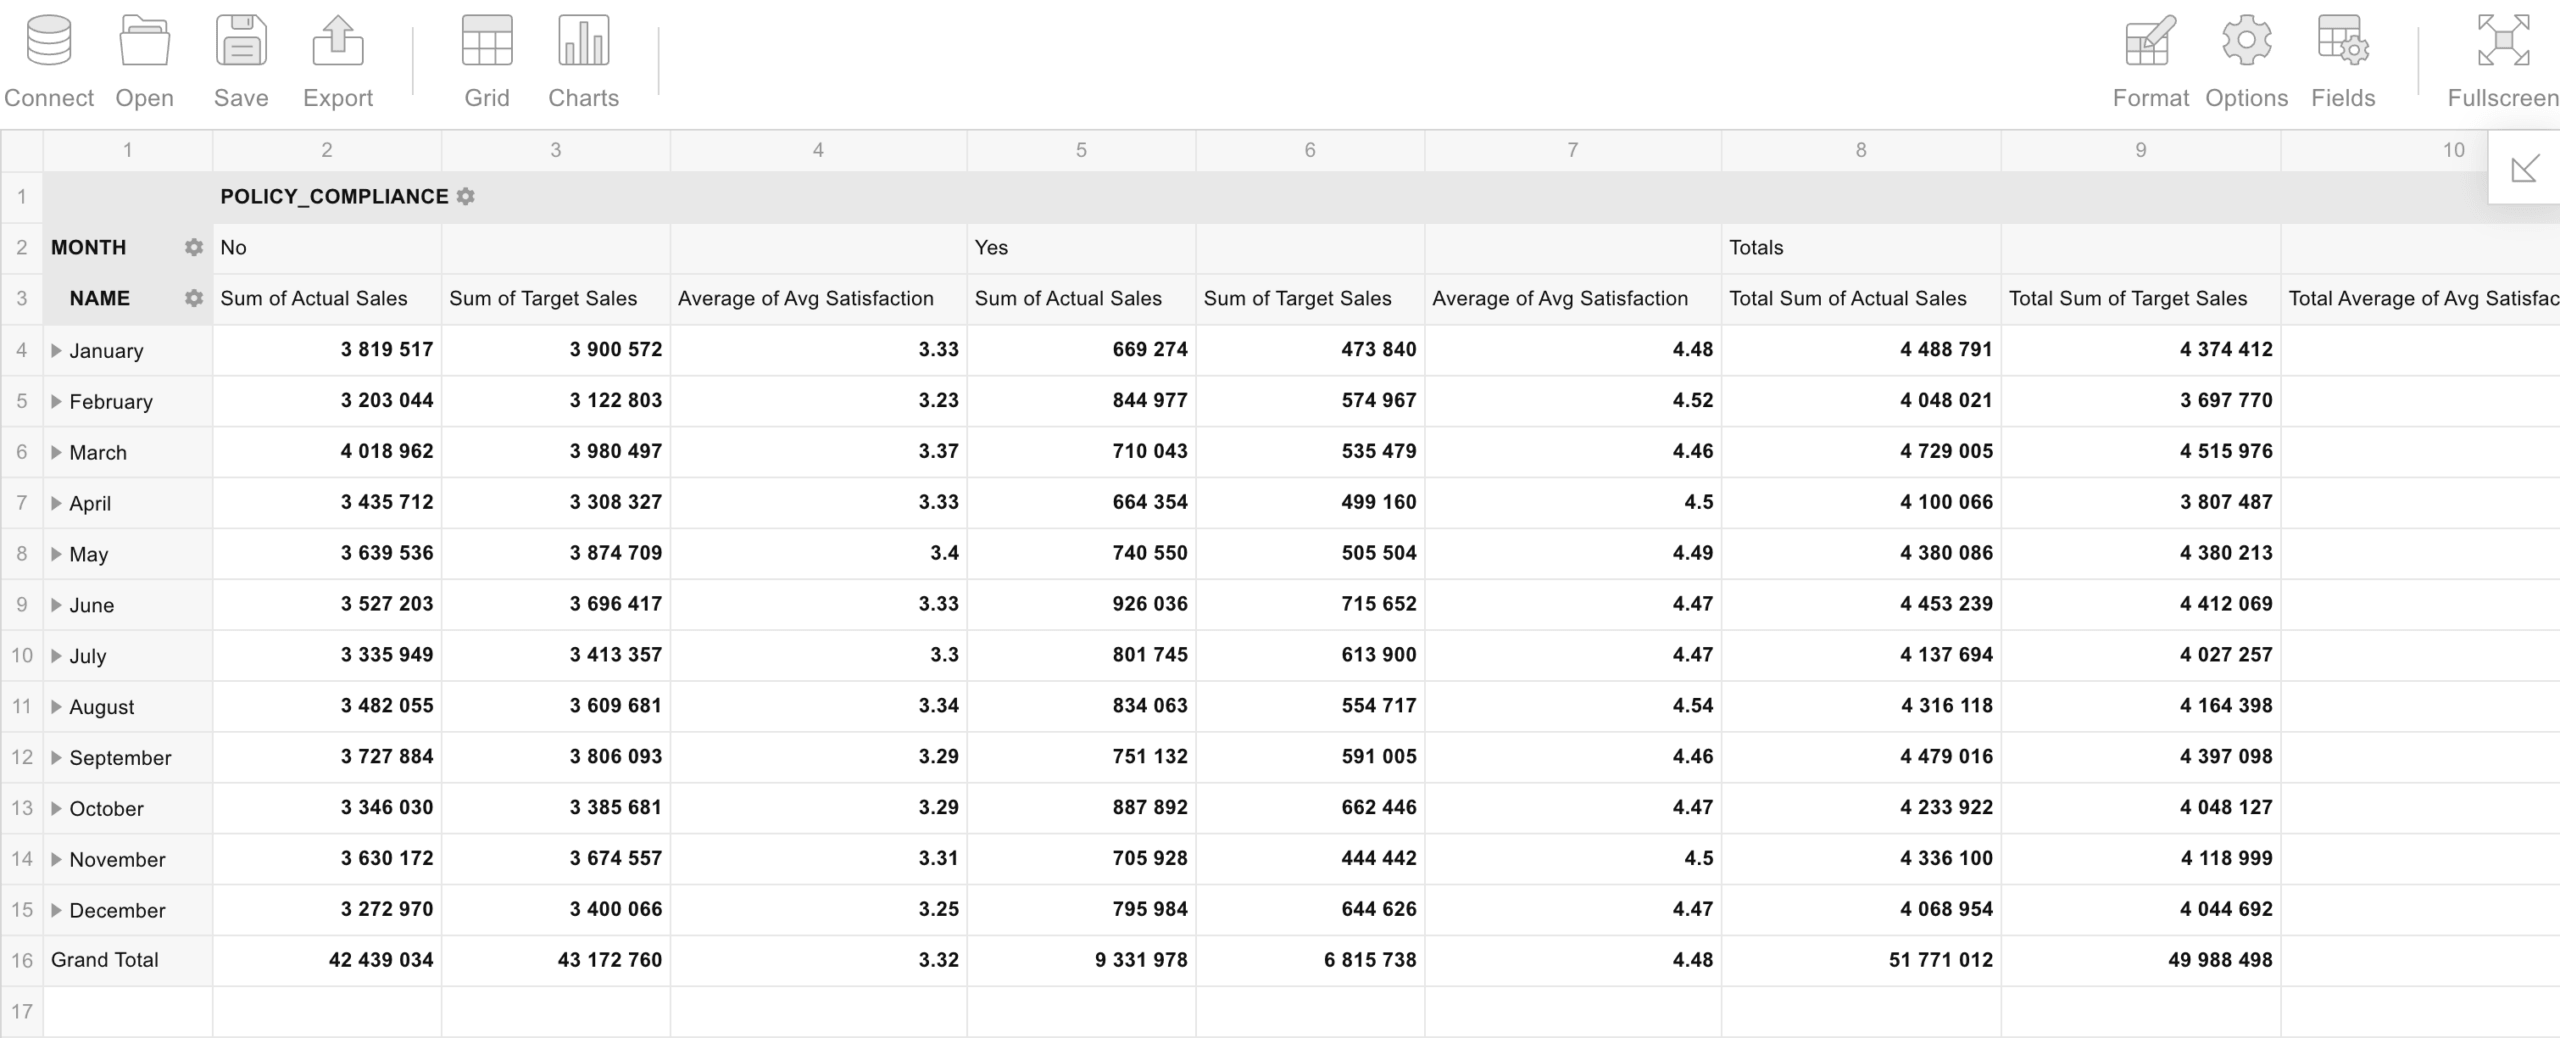
During compliance audits, Flexmonster helps managers monitor employee performance. They can group and filter data by month or employee, quickly identify low customer satisfaction or policy violations, and drill down into individual details to understand performance gaps.
Finally, for financial statement analysis, Flexmonster helps analysts move from raw financial data to actionable insights. Instead of manually reviewing spreadsheets, they can aggregate metrics such as Market Cap, P/E Ratio, and Share Price across sectors and companies, with totals and grand totals automatically calculated.
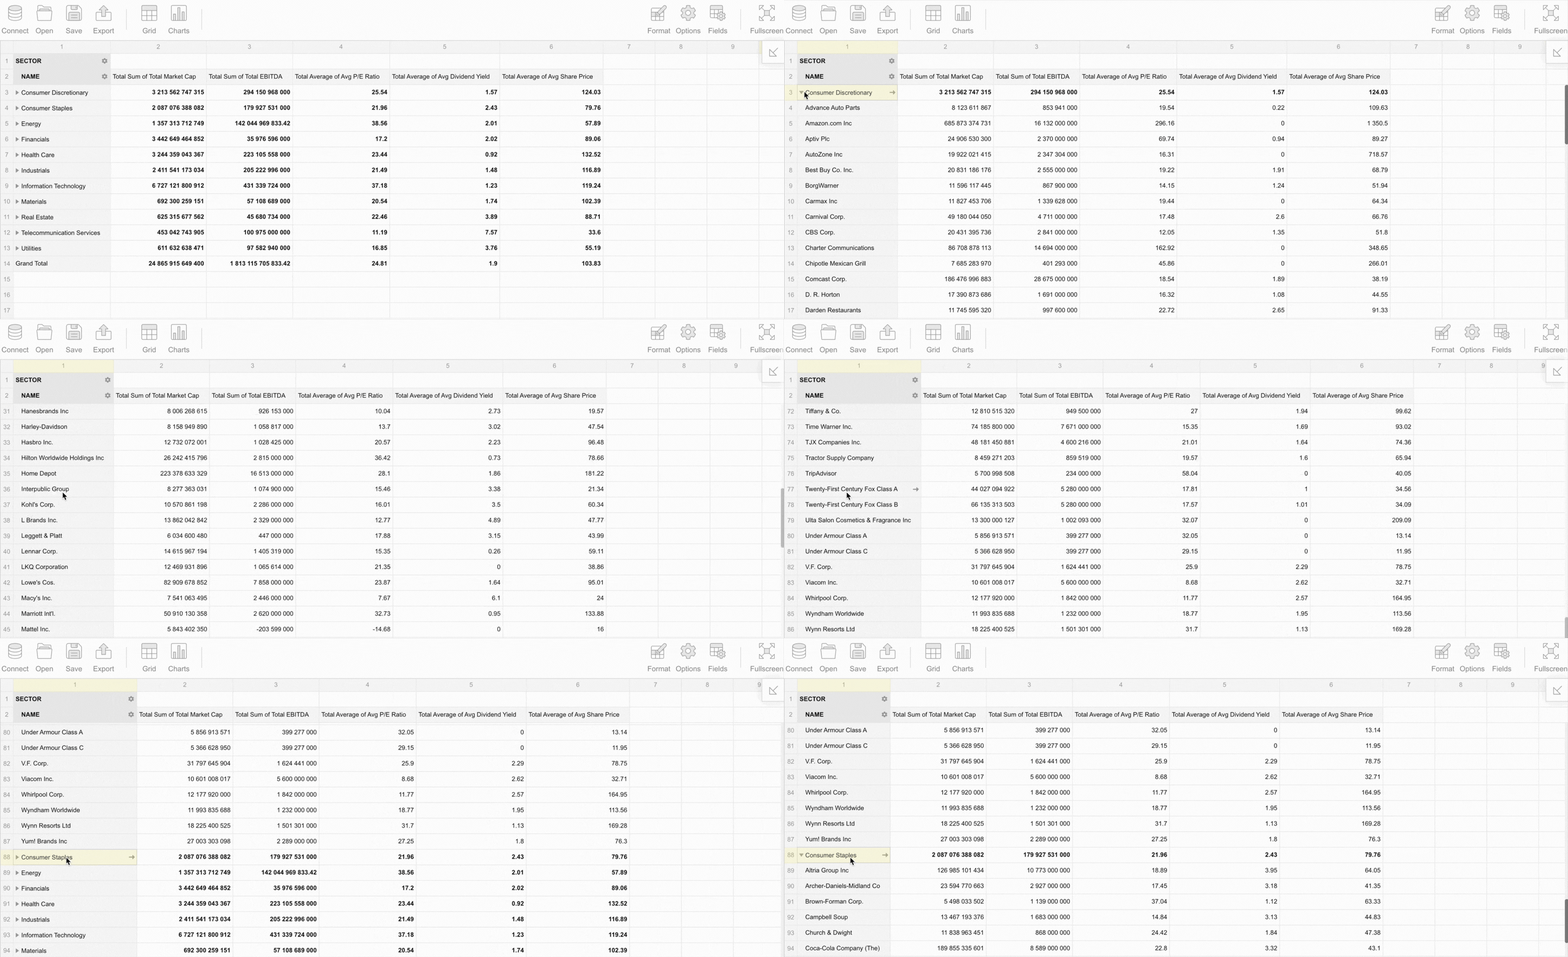
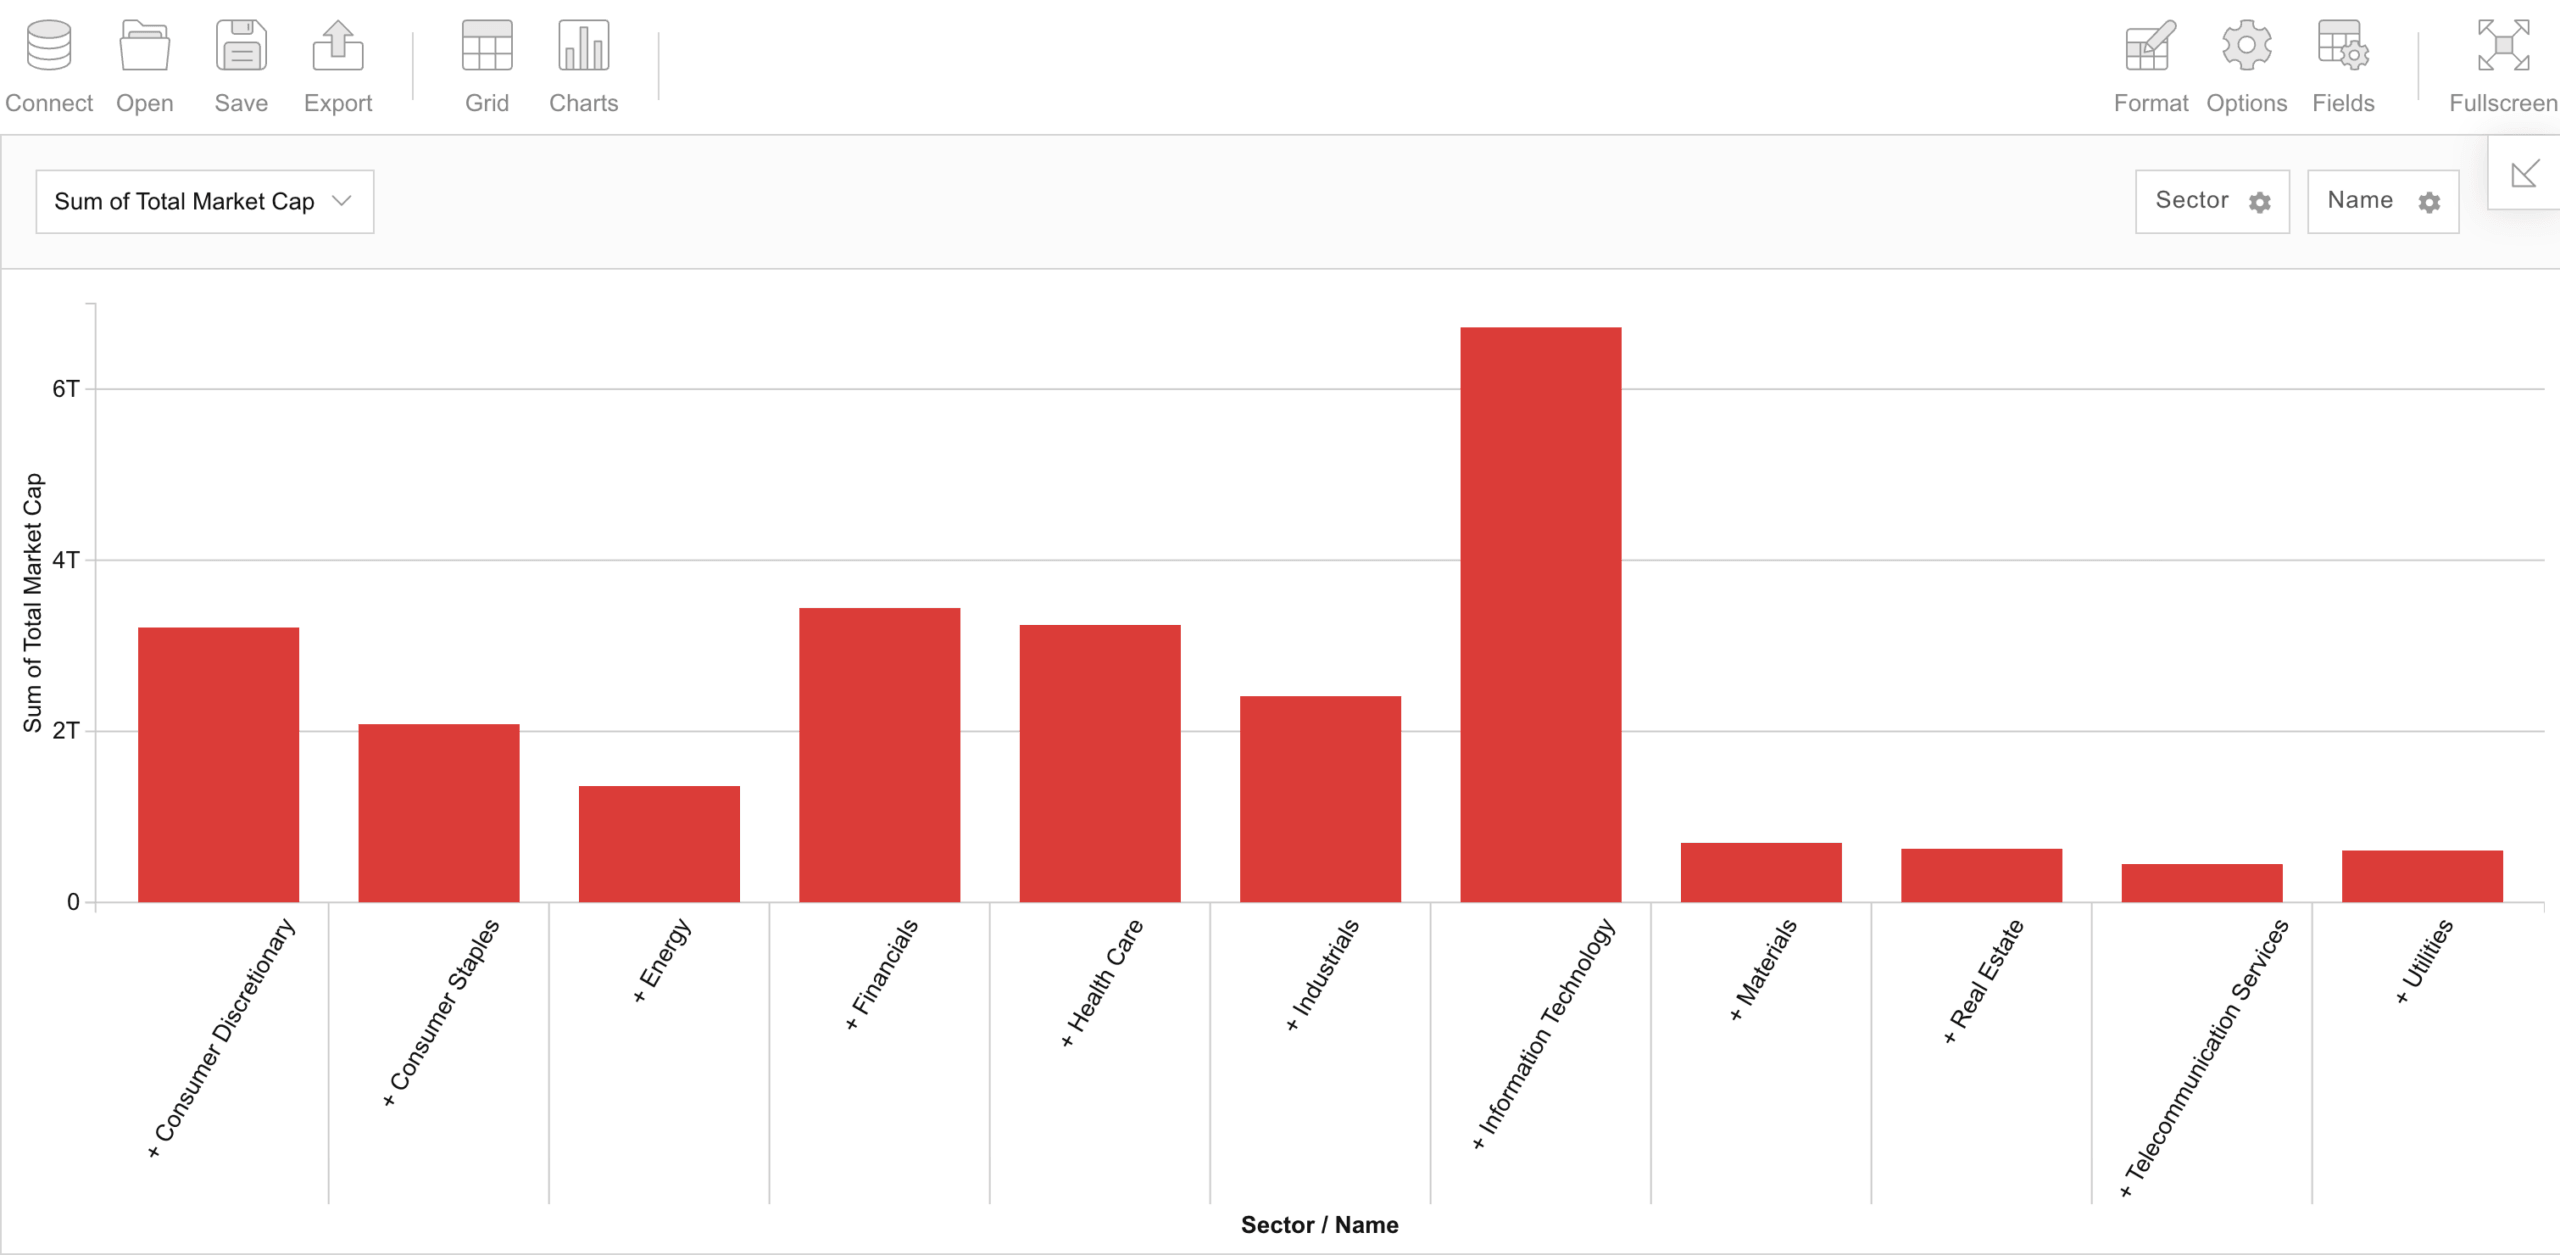
Users can also explore data with the toolbar, rearrange rows, and view Market Cap by sector in a column chart.
As we've explored, Flexmonster provides auditors with the speed, flexibility, and precision needed to handle today's complex data. From fraud detection to financial analysis, its features simplify data exploration, reduce manual work, and bring powerful insights.
Its ability to process large datasets, connect to various data sources, and deliver interactive visual analysis helps auditors move beyond basic reporting into deeper, smarter investigations.